CRM reporting
CRM reporting that shows where the money is, and where it's stuck
Most small firms find out how the month went when the accountant tells them. Beagle CRM works the figures out from the leads, quotes, invoices and purchases you already keep in it, so the answers are there the day you need them.
Open the dashboard to see what needs chasing today. Open Reports for the longer view: pipeline, revenue, debt by age, margin by product, trends and a forecast for the next twelve months.
14-day free trial with every feature. No card required.
The problem
Where small-business reporting goes wrong
-
The numbers live in four places.
Sales in one tool, invoices in another, stock in a spreadsheet. Nobody can put them side by side without an afternoon of copying.
-
You see revenue, not cash.
A strong month on paper hides the customers who haven't paid, and nobody notices until the bank balance does.
-
Margin is a guess.
Supplier prices move, but the selling price doesn't follow, and the squeeze only shows up at year end.
-
Forecasts are someone's hunch.
"Next quarter looks good" isn't a figure you can plan stock or staff around.
What's included
Your figures, already added up
-
A dashboard that starts with what's late
Overdue invoices, late supplier deliveries, low stock, overdue lead follow-ups and unassigned tasks, listed most urgent first. Each item links to the filtered list behind the number. When nothing needs chasing, it says so.
Reading the dashboard -
Trends at a glance
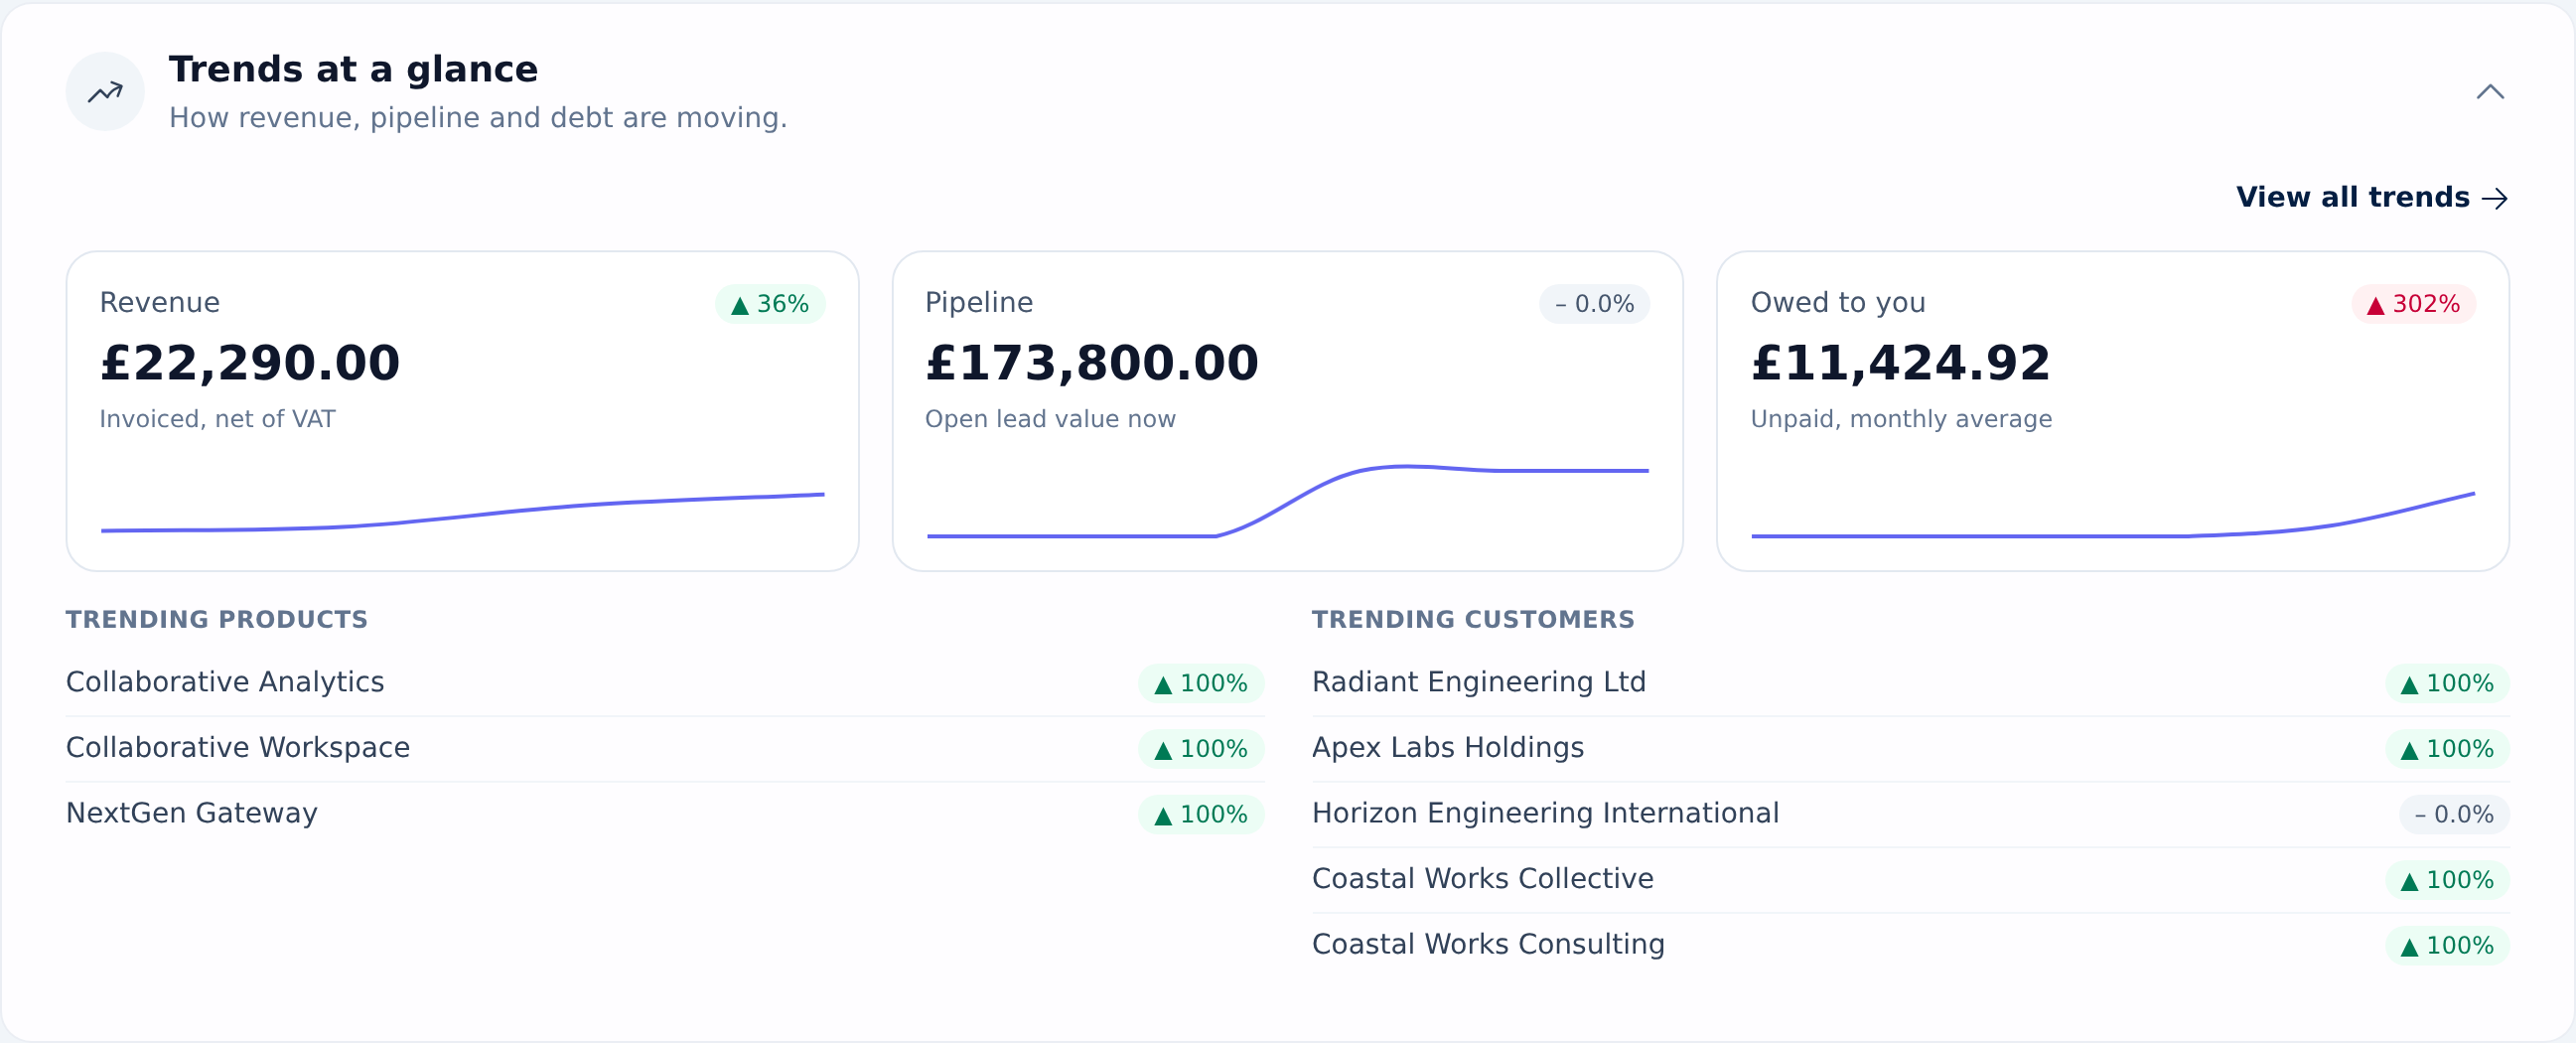
Revenue, open pipeline and money owed to you as small six-month charts, with this month's fastest-moving products and customers beside them.
How trends are worked out -
One reports page, four tabs
Overview covers pipeline, quotes, revenue, debt and customer growth. Invoices, Purchasing and Trends each go deeper, with their own date ranges and filters. A range covers exactly the dates you pick.
A tour of the Reports page -
Quote performance you can trust
The quote win rate includes quotes the customer has opened, and average days to close runs from creating a quote to the day it was accepted, so a later edit doesn't stretch it.
How quote figures are counted -
Aged debt you can act on
Outstanding and overdue balances split into current, 1–30, 31–60, 61–90 and 90+ days, plus the ten customers owing the most past their due date. Credit notes and part payments are taken off before the debt is counted.
Aged debt and overdue customers -
Invoiced against collected
Pick a date range and compare what you billed with what came in, each against the previous period of the same length, with average days to pay and bad debt written off shown on its own.
Billed versus collected -
Margin by product and spend by supplier
Gross margin per product uses the buy price recorded on each invoice line at the time of sale, so a later supplier price rise doesn't rewrite last quarter. A product with no cost price shows a dash, not a flattering 100%. Stock is valued at cost.
Product margin and stock value -
A twelve-month forecast with its working shown
One line from your open deals at full value, one from the trend in paid invoices, and a combined figure, month by month, with a confidence label on each.
How the forecast works -
Win and loss against named rivals
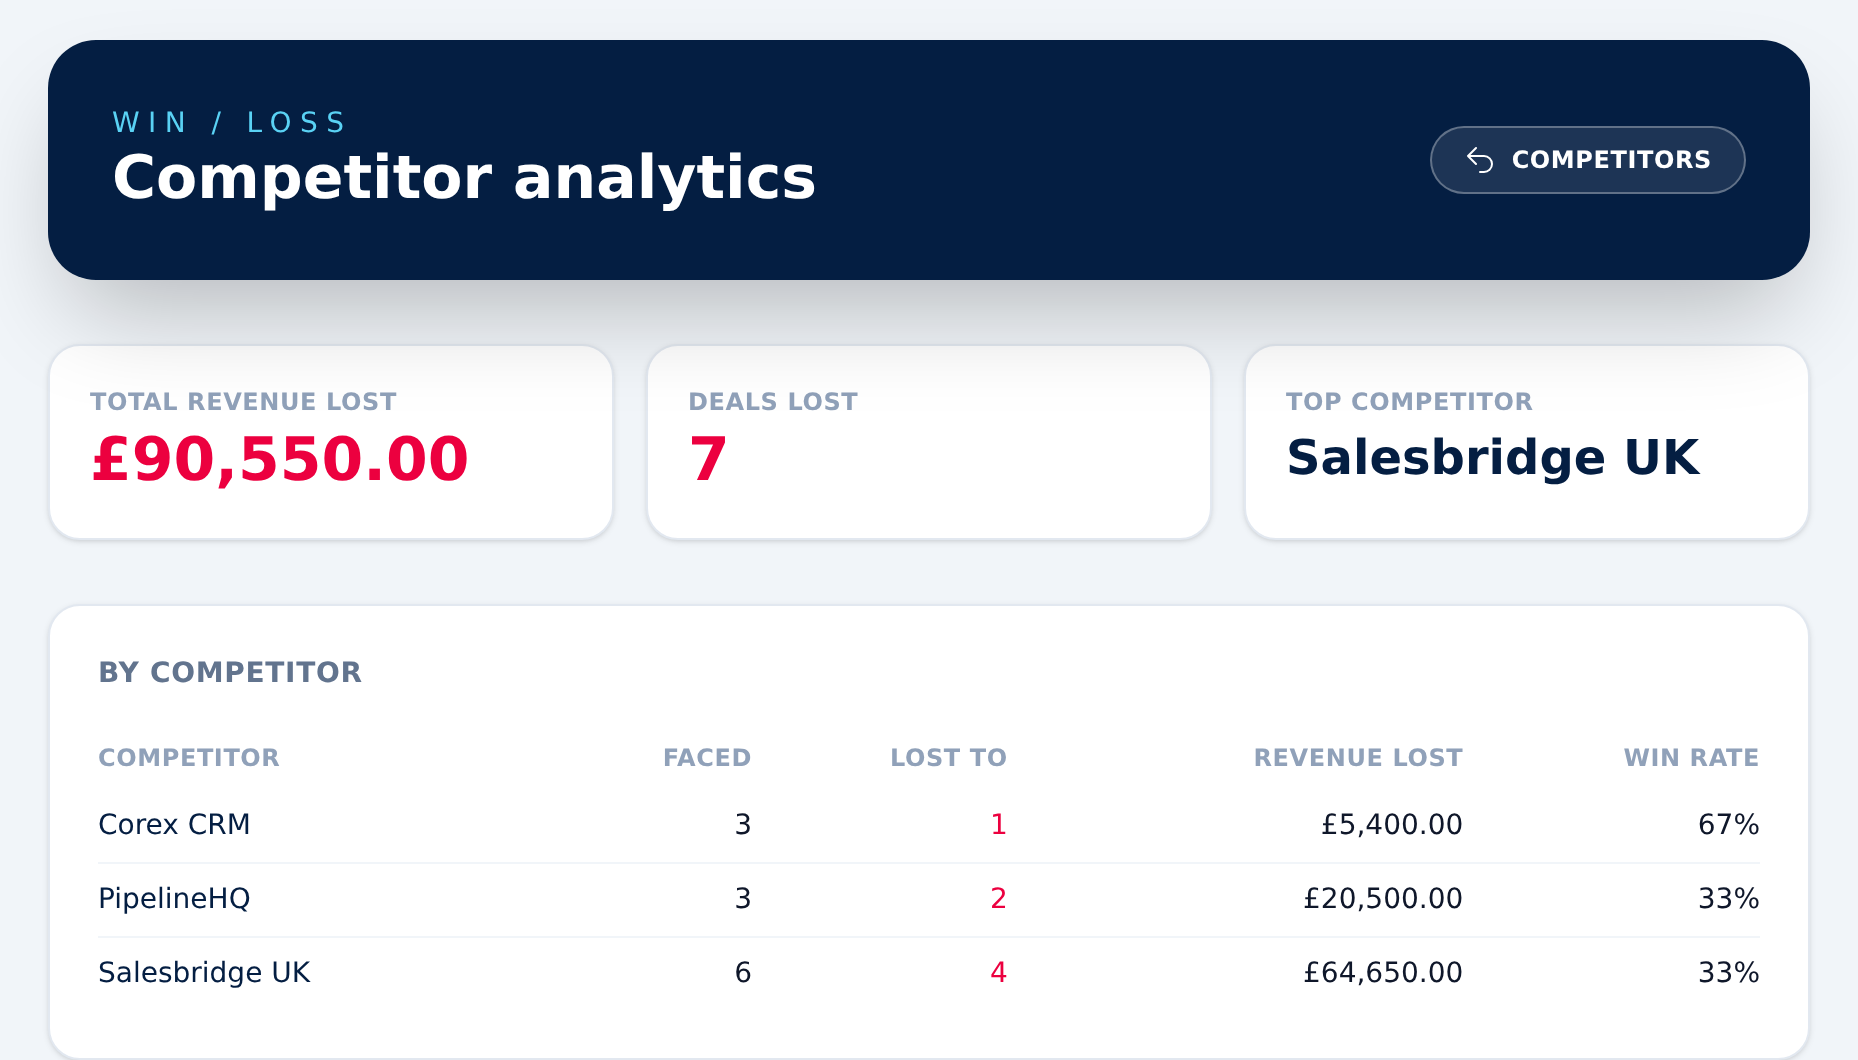
For each competitor: the deals you've faced them on, how many you won and lost, a win rate worked out over closed deals only, and the value that went with the losses.
Competitor analytics -
Exports for the bookkeeper
Invoices, purchase orders, supplier bills, stock movements and customers download as CSV files, filtered the way you set them, and the lead list as an Excel file or a PDF. Invoice PDFs come as a ZIP of up to 2,000.
Exporting report data
How it works
A month-end review, start to finish
A wholesale distributor of catering supplies sells on account to cafés, care homes and school kitchens. On the first working day of the month the operations director sits down to review the month just gone.
-
Start with what's urgent.
The dashboard lists overdue invoices first, then two purchase orders past their expected delivery date and a handful of products at or below their reorder level. Each one opens the list it counted, so the director sends the low stock list to the buyer before doing anything else.
-
Check what came in.
On the Invoices tab she sets the range to last month. Invoiced and Collected each show a change against the month before, and average days to pay sits beside them. The aging chart shows most debt is current, but one care-home group has moved into 31–60 days, and it tops the overdue customer list. That becomes a call for the credit controller.
-
Look at margin, not just sales.
The Purchasing tab ranks products by revenue with cost and margin beside each. Nitrile gloves sold well, but their margin is thin because the supplier's price went up mid-month and the selling price didn't. Spend by supplier shows how much of the month's buying went to that one wholesaler.
-
See what's moving.
On the Trends tab, a range of compostable food containers is among the fastest-growing products against the previous period. Clicking it opens that product's monthly revenue, which shows the rise has lasted three months, not one, so it's worth a larger order.
-
Look ahead.
The Overview tab's forecast shows next quarter's figure, and the forecast page breaks it down by month. A school-meals tender quoted last week sits in the open pipeline with an expected close date in November, so it lands in that month's figure at its full value.
-
Learn from a loss.
A café chain moved its supply to a rival cash-and-carry. The salesperson marked the lead lost, chose the reason and picked that competitor. Competitor analytics now shows the deal and its value against the rival's name.
-
Hand over the month.
She downloads last month's invoices as a CSV and the supplier bills as a second CSV for the bookkeeper. The review took one sitting.
What it doesn't do
The honest edges
- No report builder. The reports are fixed. You choose date ranges and filters, but you can't design your own charts or add columns.
- No scheduled or emailed reports. The daily email lists your follow-ups and tasks, not figures. Reports are read in the app.
- Deals count at full value in the forecast. The pipeline line, labelled Pipeline (full value), places each open deal's value in the month it's expected to close; it does not discount a deal for being at an early stage. A stage's probability is shown as a confidence indicator only. Deals with no close date are spread over the next three months.
- Lost reasons aren't totalled yet. Each lost lead records why, and competitor losses have their own report, but there's no chart of losses by reason.
- Trends run overnight. Trend charts are built from a nightly snapshot, so they show figures up to yesterday. Pipeline history starts from when your account began taking snapshots.
- Some figures are all-time. The date range moves the monthly charts; competitor win rates and the top-customers list cover everything you've recorded.
- The VAT tile is a guide. It shows VAT on this month's invoices. It is not a VAT return, and it doesn't take credit notes off.
- Charts don't export. You can download the data behind them (invoices, purchase orders, supplier bills, stock movements, customers and leads), but not the report page itself as a PDF.
- Pounds sterling only. Every figure is reported in GBP.
Pricing
One plan, every feature
£29 per user per month, or £290 per user per year (two months free)
Dashboards, reports, the forecast and competitor analysis come with every account. There is no reporting add-on.
All prices exclude VAT.
Questions, answered
Frequently asked questions
- What reports does Beagle CRM include?
- A dashboard of what needs attention, plus a Reports page with four tabs. Overview covers the pipeline, quote performance, revenue, debt and customer growth. Invoices shows billed against collected, aged debt and the customers who owe most. Purchasing shows supplier spend, margin by product and stock value. Trends shows which products and customers are growing.
- How does the sales forecast work?
- It projects twelve months ahead in two ways. The pipeline line takes each open deal's full value (its latest quote, or your estimate if there's no quote) and places it in its expected close month. The trend line projects from up to 18 months of paid invoices. The combined figure leans on the pipeline for the next three months and on the trend further out. With under three months of invoice history, it uses the pipeline alone.
- Can I export reports to Excel?
- You can download the underlying data. Invoices, purchase orders, supplier bills, stock movements and customers export as CSV files, which open in Excel. The lead list exports as an Excel file or a PDF. The charts themselves don't export.
- Who can see the reports?
- The Reports and Forecast pages are for Admins and Agents. An admin can also switch areas such as invoicing or purchasing off for a member, and their figures then disappear from that person's view.
- Can Beagle CRM show why we lose deals?
- Partly. Every lost lead records a reason, and you can name the competitor who won it. Competitor analytics then shows, for each rival, the deals you faced them on, the deals you lost to them and the value lost. There isn't yet a chart that totals losses by reason.
- Is the VAT figure on the reports page my VAT return?
- No. It adds up the VAT on invoices dated this month as a guide. It doesn't include VAT on your purchases or take off credit notes, and Beagle doesn't file returns.
Related
- Lead management Track every lead on a drag-and-drop pipeline, with a next step and due date on each one. Beagle CRM flags stalled deals. £29 per user, 14-day free trial.
- VAT invoicing Invoice with VAT set per line, your VAT number on each PDF, card pay links, part payments, credit notes and CSV exports. Built for UK small businesses.
- Quoting software Build quotes from your catalogue, discount any line, email a PDF with your logo and see when the customer opens it. Quoting software for UK businesses.
- CRM for small businesses One CRM for a small UK team: leads, customers, quotes, VAT invoices, a shared inbox and a service desk. £29 per user, every feature, 14-day free trial.
- Ask Oscar AI search Ask your CRM in plain English. Oscar searches on Beagle's own server, shows only records you may open and links every source. 14-day free trial.
Close the month with the numbers already done
Try every report free for 14 days with no card, or book a demo and we'll walk through your own figures with you.